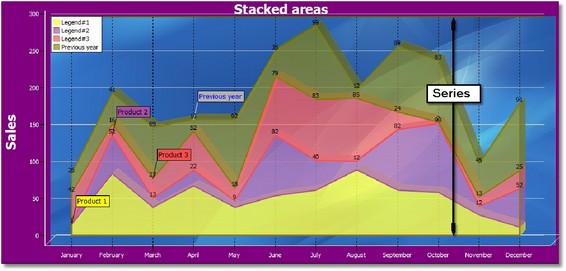
This tag allows to embed data values within the report file. The values are used by the <CHART> tag.
Syntax:
<DATA=Data_Name>
TAB delimited list |
||||||||
|---|---|---|---|---|---|---|---|---|
Series_Number |
X_Value or Name |
Color |
Icon |
Annotation |
Value_1 |
Value_2 |
Value_3 |
Value_4 |
... |
|
... |
... |
... |
... |
... |
... |
... |
... |
|
... |
... |
... |
... |
... |
... |
... |
</DATA>
Format:
o<DATA>, </DATA>, one point per line:
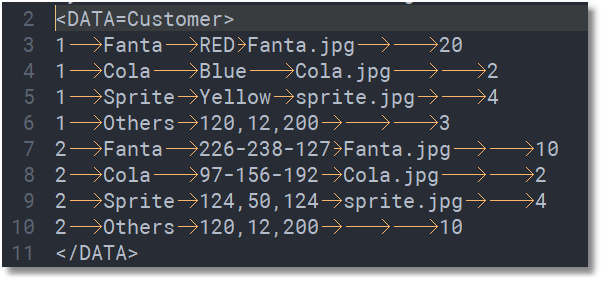
oThe lines between the <DATA> and </DATA> tags define the points to insert in the chart.
oEach point is defined with a tab delimited list. (Tab is #9, chr(9) or ~t depending on the programming language)
<DATA=Data_Name,FILE=file_name> where the external file_name contains:
Parameters:
•Series_Number: |
Mandatory |
Range 1 to n |
•X_Value or Name |
Optional |
In a chart, set the label that appears in the X axis In a pie, set the name of a slice |
•Color |
Optional |
List of colors delimited by a slash / 1.Individual color of the point or bar 2.Background color of the annotation 3.Font color of the annotation, 4.Line color of the annotation
Notes: By default, annotations have the same background color than the series. If no individual color is specified, a random color is set.
Examples: red/yellow/black/255-255-255 /green/white /ltred/white
See to see the available values. |
•Icon |
Optional |
Name of an image file that represents the point |
•Annotation |
Optional |
No effect on pies |
•Value_1 |
Mandatory |
Decimal value. Y value in a chart, slice in a pie |
•Value_2 to value_4 |
Optional |
// Reserved for a future use // |
Notes:
•the way that the data are displayed depends on the chart type. Differences exist if the graphic is a pie or a chart. See the tag for more information.
•the </DATA> tag must be the first tag in a line
Examples:
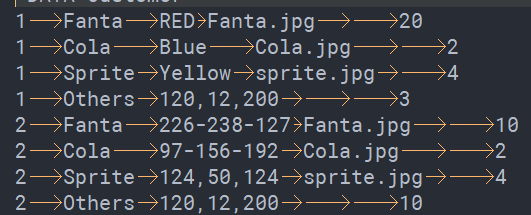
PIE:
Serie |
Name |
Color |
Icon |
Annotation |
Value |
|---|---|---|---|---|---|
1 |
Fanta |
red |
fanta.jpg |
25 |
|
1 |
Cola |
blue |
cola.jpg |
2 |
|
1 |
Sprite |
yellow |
sprite.jpg |
4 |
|
1 |
Others |
120-12-200 |
10 |
||
2 |
Fanta |
226,238,127 |
fanta.jpg |
10 |
|
2 |
Cola |
97,156,192 |
cola.jpg |
2 |
|
2 |
Sprite |
124,50,124 |
sprite.jpg |
18 |
|
2 |
Others |
120-12-200 |
32 |
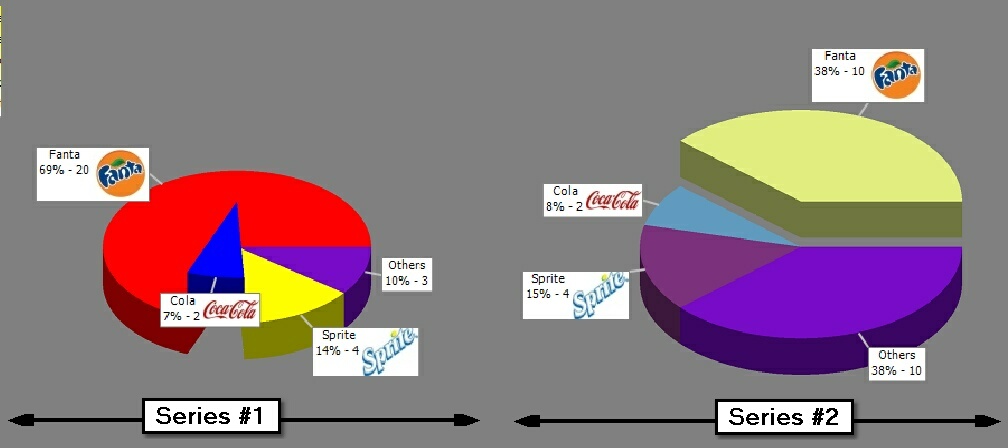
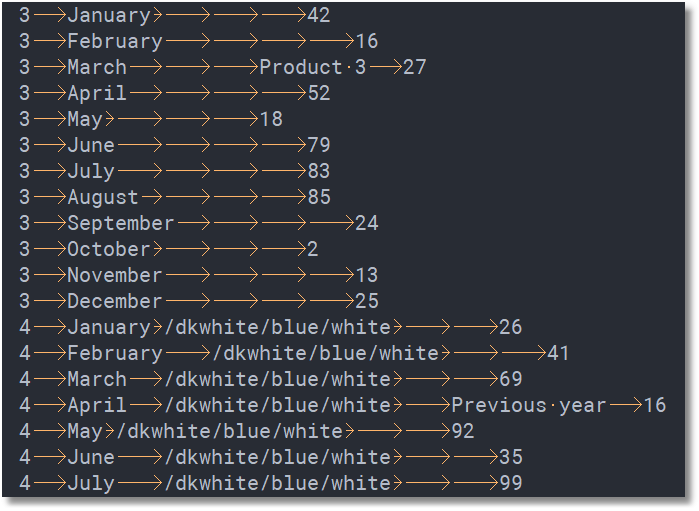
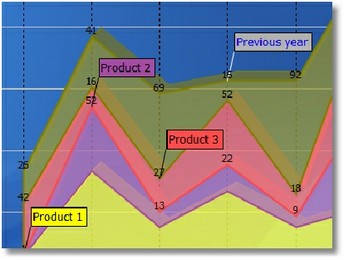
CHART:
Serie |
Name |
Color |
Icon |
Annotation |
Value |
|---|---|---|---|---|---|
1 |
January |
red |
25 |
||
1 |
February |
blue |
2 |
||
1 |
March |
yellow |
4 |
||
1 |
April |
/120-12-200/red/white/red |
10 |
||
... ... |
|||||
2 |
226,238,127 |
10 |
|||
2 |
97,156,192 |
2 |
|||
2 |
124,50,124 |
18 |
|||
2 |
120-12-200 |
32 |