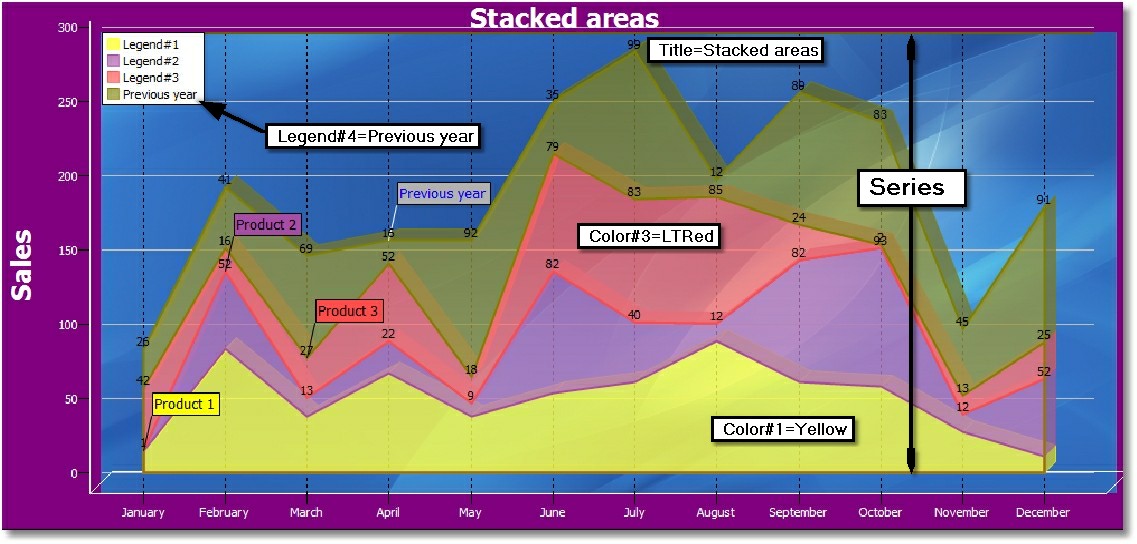
<CHART#1, TYPE#1=stackedarea,TYPE#2=stackedarea,TYPE#3=stackedarea,TYPE#4=stackedarea, DATA=demochart, Color#1=yellow,Color#2=LTPurple,Color#3=LTRed,Color#4=Olive, BGCOLOR=purple, LEGEND#1=Legend#1,LEGEND#2=Legend#2,LEGEND#3=Legend#3,LEGEND#4=Previous year, 3D=10, BACK=1, XCOLOR=white, XFCOLOR=white, XYStyle=Tahoma/18/B, TStyle=18/B, TITLE=Stacked areas, YTITLE=Sales>'
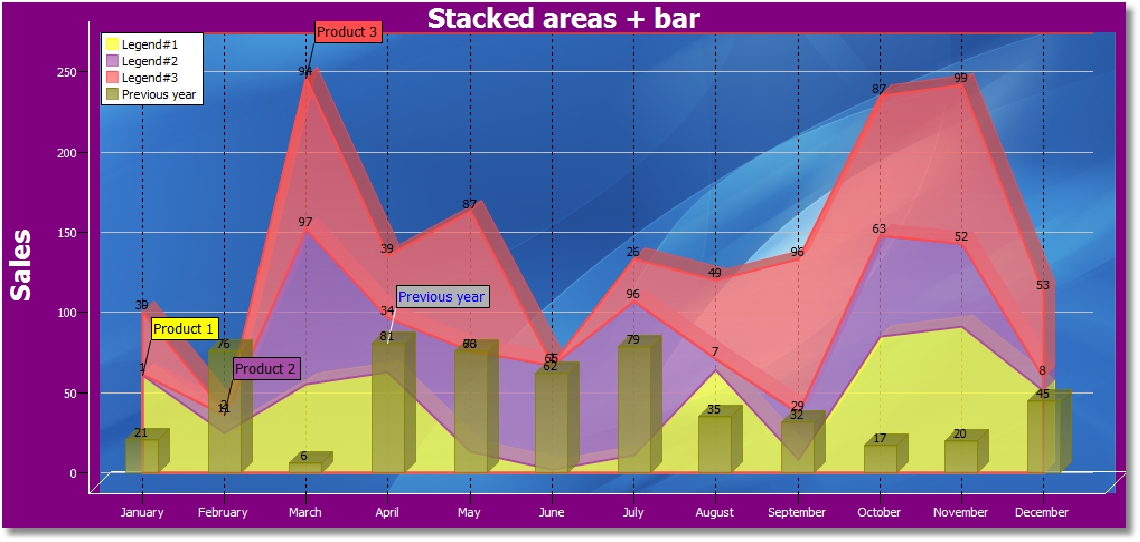 TYPE#1=stackedarea,TYPE#2=stackedarea,TYPE#3=stackedarea,TYPE#4=BAR,
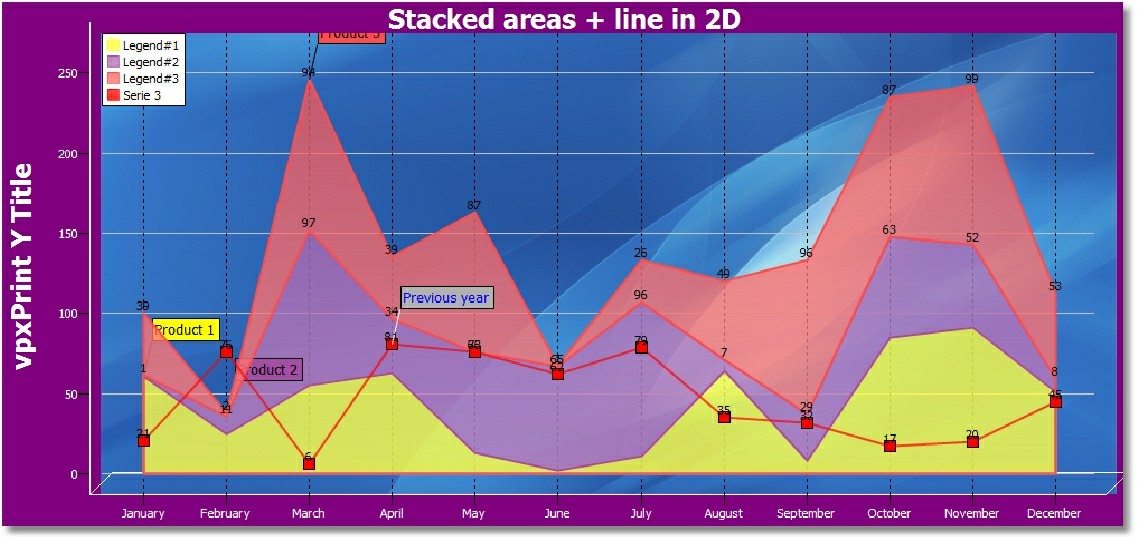 TYPE#1=stackedarea,TYPE#2=stackedarea,TYPE#3=stackedarea,TYPE#4=LINE, MARKER#4=Square,
// without 3D=10
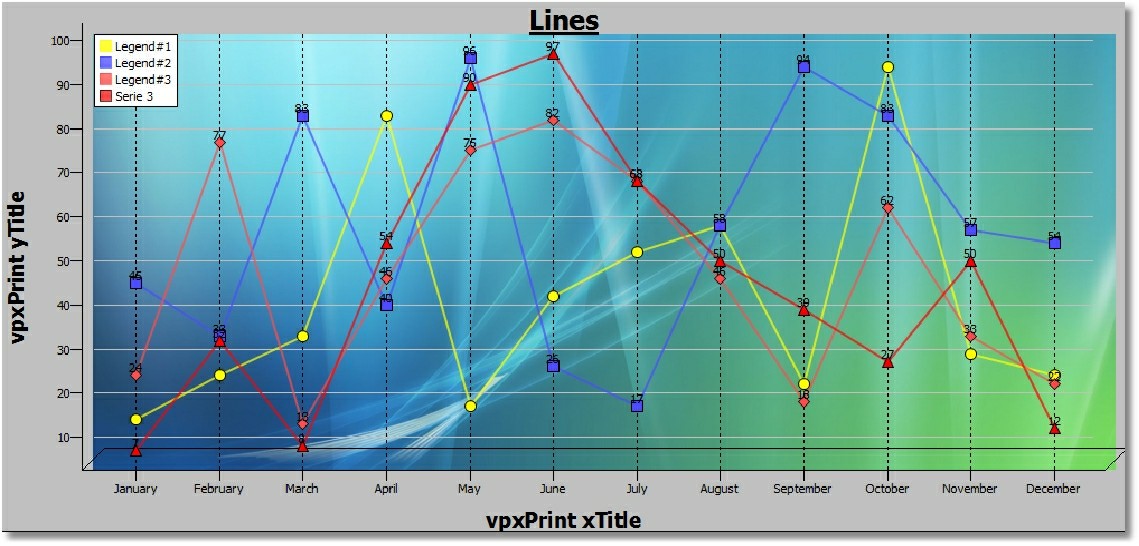 TYPE#1=LINE,TYPE#2=LINE,TYPE#3=LINE,TYPE#4=LINE, MARKER#1=Circle,MARKER#2=Square,MARKER#3=DIAMOND,MARKER#4=Triangle, BACK=2
|
|