The XLS tag can be used to specify different actions on the excel sheet, add formulas, draw a chart, etc.
XLS tag has no action on standard vpxPrint report, it just specifies additional actions for Excel export.
The Excel export is available from the export window or with the tag.
Multiple <XLS> tags may exist in the report.
If you want to give a specific name to the different sheets, insert <XLS:SHEET=xxxxxxxxx> on the pages.
You can also insert multiple <XLS:CHART> to build more charts in the sheets.
Syntax:
The first syntax <XLS:xxxxxxxxx> tag is used to execute a series of Excel actions
<XLS:Excel_Action_List>
while <XLS-xxxxxxxxx> tag is used to specify different Excel settings.
Setting of header and footer:
<XLS-LEFT-HEADER=left header value>
<XLS-CENTER-HEADER=center header value>
<XLS-RIGHT-HEADER=right header value>
<XLS-LEFT-FOOTER=left footer value>
<XLS-CENTER-FOOTER=center footer value>
<XLS-RIGHT-FOOTER=right footer value>
Setting the decimal delimiter:
vpxPrint has no information about the decimal format of numbers, they appear as strings in the xpr file.
European users generally use a comma character as decimal separator and a point for the thousands. For other users, the point is the decimal separator.
Numbers can have a decimal fraction, or not...
To avoid any error in Excel export, It's safe to define the decimal separator that you use in the report.
European users must use <XLS-DECIMAL=,> if they use -E Progress parameter
Setting the date format and delimiter:
sets the value of the date delimiter, if different from the standard local Windows setting.
Example: "01.03.2015" and <XLS-DELIM=.> specify that day, month and year are separated by a dot.
indicates the format of the date in the report, if different from the standard Windows setting.
Examples: <XLS-DATE=mdy> or <XLS-DATE=dmy>
Direct sending to Excel:
The Excel convention format for dates is m/d/y and numeric values use a point as the decimal separator without thousands separators.
vpxPrint tries to recognize the type of a cell before sending to a Excel cell:
1.Is the current value a valid date?
a.if yes, convert it using the date delimiter and the dmy-mdy setting (or other) and send it to Excel
2.If not a valid date, is it a valid numeric value? vpxPrint will:
a.apply the decimal delimiter, if any. if not specified, try to determine it.
b.delete the thousands separators,
c.ignore the money signs (£, $ or €)
d.some values begin with +-, normalize them,
e.then, is the result valid? if yes, send the modified value
3.If no a date or a numeric, send the original value.
This process, applied for each cell, is time-consuming.
If you just want to create an Excel file without preview or printing, you may be interested by:
<XLS-DIRECT>
This tag tells to vpxPrint to send the input values directly without any additional process, that can speed up the sending process by 20% for important files.
But that means that you must:
1.use m/d/y dates,
2.use decimal values in >>>>>>>>9.99 format with a decimal POINT and WITHOUT THOUSANDS SEPARATORS. Of course, you can apply a XLS-FORMAT to those cells.
Open the Excel file:
The Excel file can be opened with
<XLS-OPEN>
The <XLS:xxxxxxxxx,xxxxxxxxxx,xxxxxxxxxxx> interacts with Excel as a comma delimited list of commands.
Before sending any command through the OLE link, vpxPrint replaces sequences in the <XLS:> tag:
•%A is replaced by the first column identification,
•%Z " " " " last " " " " "
•%1 is replaced by the first line number,
•%9 is replaced by the last line number
•%X is replaced by the column identification pointed by X
•%Y is replaced by the line number pointed by Y
vpxPrint evaluates % variables step by step, when processing individual entries and not before processing the full sequence of commands.
Example:
<XLS:CHART,X=%A,X++,SELECT=%X,VALUES>
(chart source is set to the 2nd column of the Excel array)
The Excel_Action_List parameter is a comma delimited list where each entry is one of the following :
Keyword |
Explanation |
Note |
CHART |
Draws a chart on the current excel sheet. The default is a vertical '3D Pie exploded' chart with all the data of the sheet. Default value is the last column. The syntax of the CHART keyword is : CHART [=xlChartConstant ] where xlChartConstant is the value of the chart type (See Excel constants) |
|
SELECT |
Selects a range of cells in the current sheet.
Syntax: SELECT=valid_excel_range
The specified value must be an Excel valid range syntax. |
The notation is in format A1. Examples: SELECT=A1:C10 SELECT=%A%1:C%9
|
XVALUES |
Sets the current selected range as the X values for the graph |
After CHART and SELECT |
VALUES |
Sets the current selected range as the values for the graph |
After CHART and SELECT |
NAME |
Names the current selection |
After SELECT |
X |
sets a column number (A-Z). Syntax: X= number sets X to a given column X+1 increase X by 1 FIRST sets X to the first column LAST sets X to the last filled column -OR- X++ increase X by 1 -OR- X- - decrease X by 1 -OR- X=%A X=%Z |
Examples: X=3 X++
Y=%9,Y++,Y++,SELECT=%Z%Y
When sent to Excel, the %X is converted to EXCEL range letters.
|
Y |
Sets a line number. Syntax: Y= number sets Y to a given line Y+1 increase Y by 1 FIRST sets Y to the first line LAST sets Y to the last filled line -OR- Y++ increase Y by 1 -OR- Y- - decrease Y by 1 -OR- Y=%1 Y=%9 |
Y=%9,Y++,Y++,SELECT=%Z%Y
selects the cell two rows below the last one. |
SAVE |
Saves the Excel workBook. Syntax: SAVE=filename |
|
FORMULA |
Inserts an Excel formula in the selected range area. Syntax: FORMULA=Excel_Formula |
After SELECT Specify a double equal sign for formulas: FORMULA==Sum(E2:E%9) |
FORMULAR1C1 (*) |
Inserts a formula in R1C1 mode in the selected range area. Syntax: FORMULAR1C1=Excel_Formula |
|
VALUE |
Sets the value for the current selected range. Syntax: VALUE=xxxxxxxxxxxxxxxxxxxxx |
After SELECT |
HOR |
Switches to an horizontal serie (CHART orientation defaults to vertical if HOR is not specified) |
After CHART |
TITLE |
Chart title. Syntax: TITLE=xxxxxxxxxxxxxxxxxxxxxxxxxxxx |
After CHART |
SOURCE |
Sets the current selected range as the chart source. |
After CHART and SELECT |
VISIBLE |
Sets the Excel window as visible. |
The Excel window is shown immediately when this tag is processed. Mandatory if the SAVE= keyword is specified. |
SHEET (*) |
Sets the name of the current sheet. Syntax: SHEET=xxxxxxxxxxxxxxxxxxxxxxxxxxxxx |
After CHART If the Excel file contains only one sheet, this is the name of the unique sheet. In case of multiple sheets, this tag can be used to set the names of the additional sheets.
|
CENTER (*) |
Centers the content of the selected cells. Syntax: CENTER |
After SELECT Example: SELECT=D:D,CENTER |
RIGHT (*) |
Right justifies the content of the selected cells. Syntax: RIGHT |
|
LEFT (*) |
Left justifies the cells(s) Syntax: LEFT |
Default mode |
STYLE (*) |
Syntax: STYLE=Currency |
Available values: Currency
|
FORMAT (*) |
Specifies the Excel number format of the selected cells.
Syntax: FORMAT=ffffffffffffffffffffffffffffffffffffffffff
where fffffffffffffffffffffffff is the number format |
Examples: #\,##0.00 $;[Red]#\,##0.00 $ #\,##0.00 0.00% # ??/?? 0.00E+00 Note: Commas must be escaped with a \ character. |
FONT (*) |
Font name of the selected cells. |
|
SIZE (*) |
Font size Syntax: SIZE=nn |
|
BGCOLOR (*) |
Sets the background color of the cells. Syntax: BGCOLOR=xxxxxxxxxxx
where xxxxxxxxxx is a vpxPrint color or a RGB value like in the vpxPrint tag.
|
As the comma is a delimiter in the XLS tag, you must escape the commas with a backslash to specify RGB values. Any character can be accepted as the delimiter: BGCOLOR=182\,15\113 BGCOLOR=182-15-113 |
FGCOLOR (*) |
Sets the font color. |
See BGCOLOR above. |
ITALIC (*) |
Sets the characters in italics. |
|
BOLD (*) |
Sets the characters in bold mode. |
|
LANDSCAPE (*) PORTRAIT |
Sets the portrait or landscape printing mode. |
|
GRID |
Cell grid lines are printed on the page |
|
Sets the FITT and FITW to 1. Adjusts the zoom to fit the worksheet on one page. |
|
|
FITT |
Syntax: FITT FITT=n Sets the number of pages tall the worksheet will be scaled to when it's printed. (FitToPagesTall) |
Excel FitToPagesTall value.
Default value = 1 |
FITW |
Syntax: FITW FITW=n Sets the number of pages wide the worksheet will be scaled to when it's printed. (FitToPagesWide) |
Excel FitToPageswides value.
Default value = 1
FITW=1,FITT=999999 will adjust the report to the width |
HEADERL HEADERC HEADERR |
L: Sets the alignment of text on the left header of a workbook. C: Center aligns the header information. R: Sets the right part of the header |
Examples: &"Arial Black,Italic"&14My Title
|
FOOTERL FOOTERC FOOTERR |
L: Sets the alignment of text on the left footer of a workbook. C: Center aligns the footer information R: Sets the right part of the footer |
|
Examples:
<XLS:CHART>
<XLS:SELECT=%A%1:C%9,CHART,HOR>
How does it work?
The main principle is to write lines like:
Field1 Field1 Field2
----------------- ---------------- -------------------------
Xxxxxxxxx yyyyyyyy zzzzzzzzzzzzzzzzz
Zzzzzzzzzzz aaaaaaaaaaa uuuuuuuuuuuuuuuuuuuuuuu
And vpxPrint will create a basic excel file.
The line with -------------- ------------ determines the position and the size of fields.
![]() Do not use <C> positioning in this line, use spaces as delimiters.
Do not use <C> positioning in this line, use spaces as delimiters.
Above and below this line, simply adjust the column titles (above) and the line contents (below) with the exact position. On these lines you can use <C> and any other tags: font, justify etc.
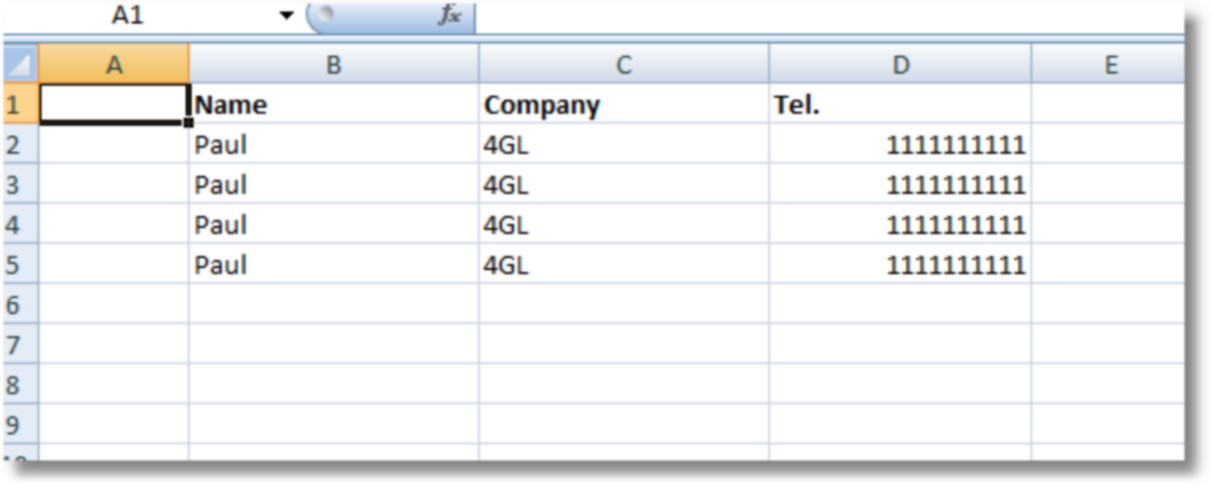
So the easiest example is:
<PREVIEW>
<C10>Name<C30>Company<C50>Value
bbbbbbbbb----------bbbbbbbbb------------------bb-------------- // bbb = spaces
<C10>Paul<C30><CENTER=C49>4GL<C50>15000
<C10>Pierre<C30><CENTER=C49>IBM<C50>10000
<C10>George<C30><CENTER=C49>Microsoft<C50>12000
<C10>Phil<C30><CENTER=C49>Epson<C50>3000
</USE>
</USE> closes the array of the current display.
You can add specific XLS tags:
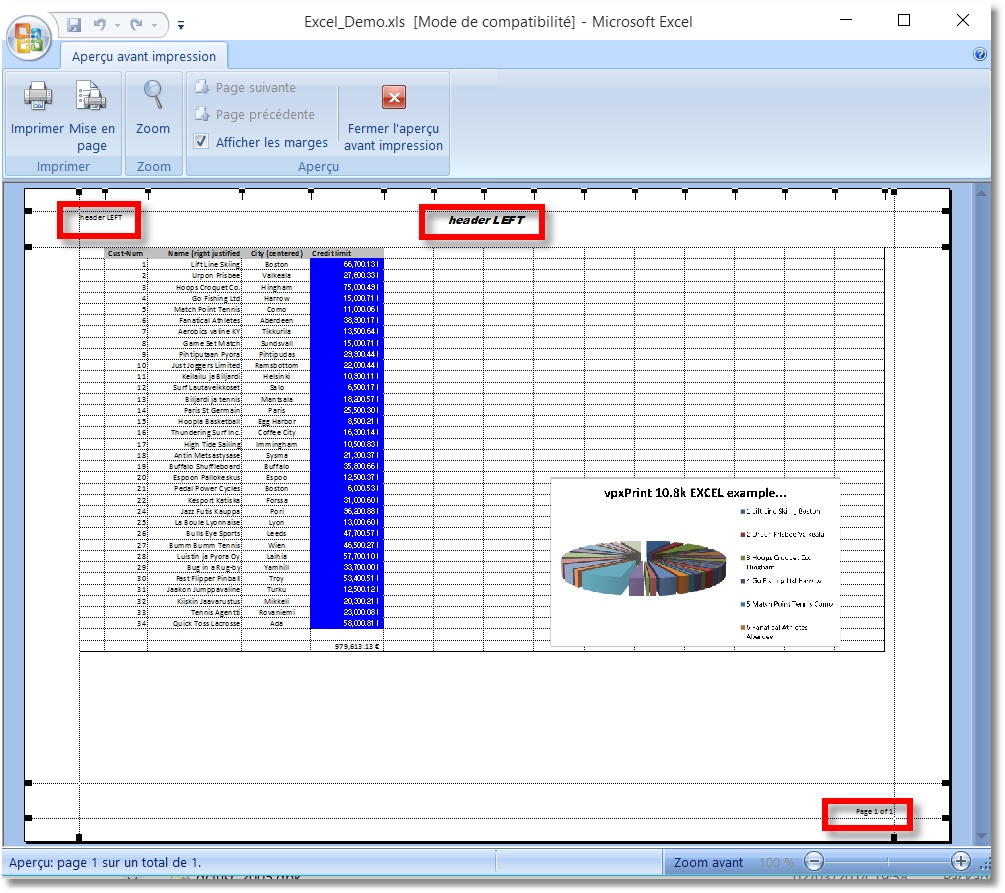
<XLS:CHART,Title=vpxPrint Excel example...>
<XLS-LEFT-HEADER=LEFT HEADER>
<XLS-CENTER-HEADER=CENTER HEADER>
<XLS-RIGHT-HEADER=RIGHT HEADER><XLS-LEFT-FOOTER=LEFT FOOTER><XLS-RIGHT-FOOTER=RIGHT FOOTER><XLS-CENTER-FOOTER=CENTER FOOTER>
Result:
When clicking on the export button in the preview window, the export window pops up with "Excel" button available (if a valid Excel structure is found in the file):
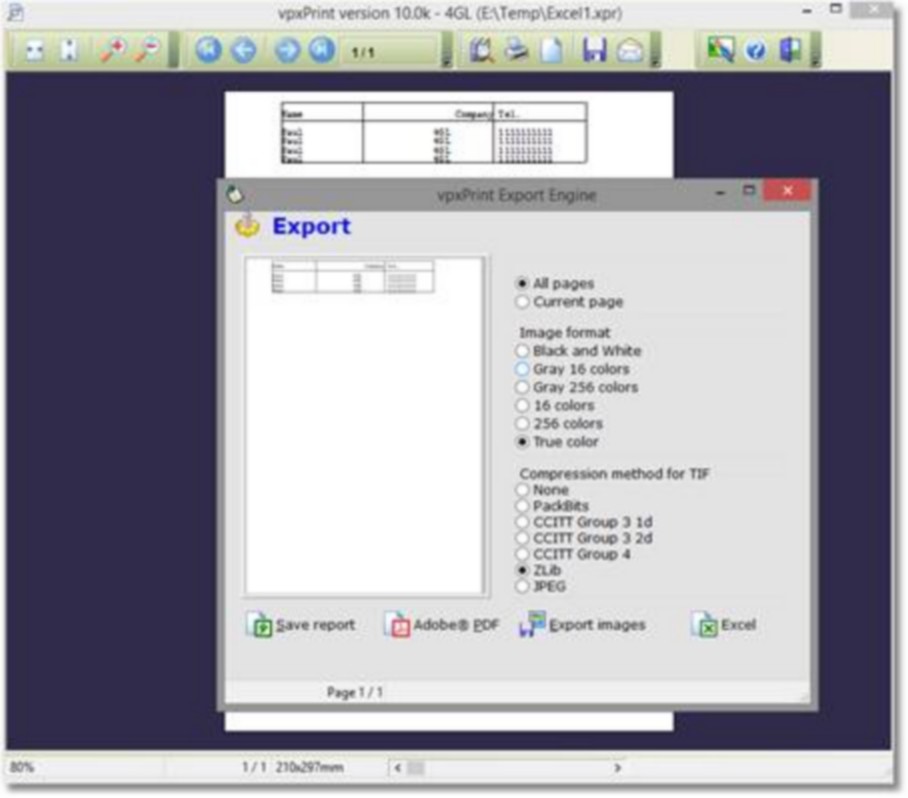
It opens Excel:
If you simply add <XLS:CHART,Title=vpxPrint EXCEL example...>
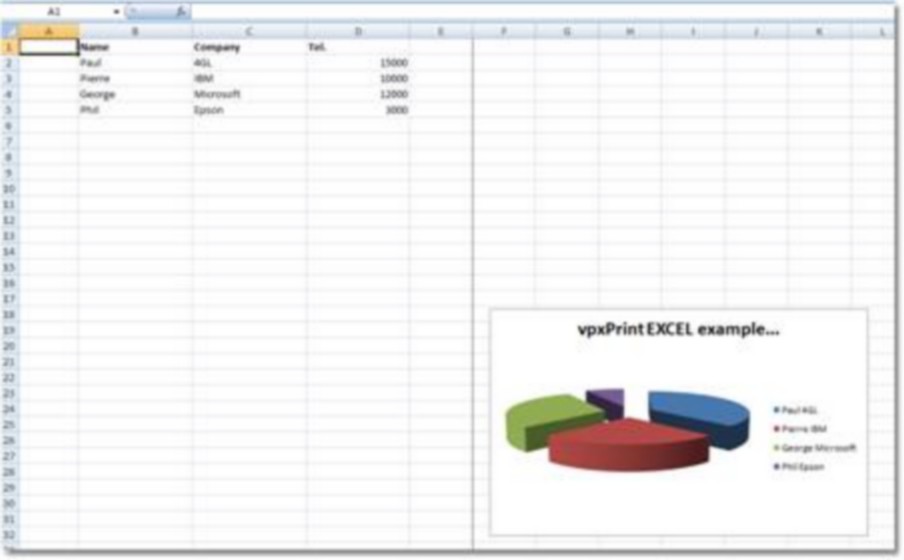
With the <XLS> tag, you can fully customize your chart: lines or columns color, font, justification or alignment.
Example:
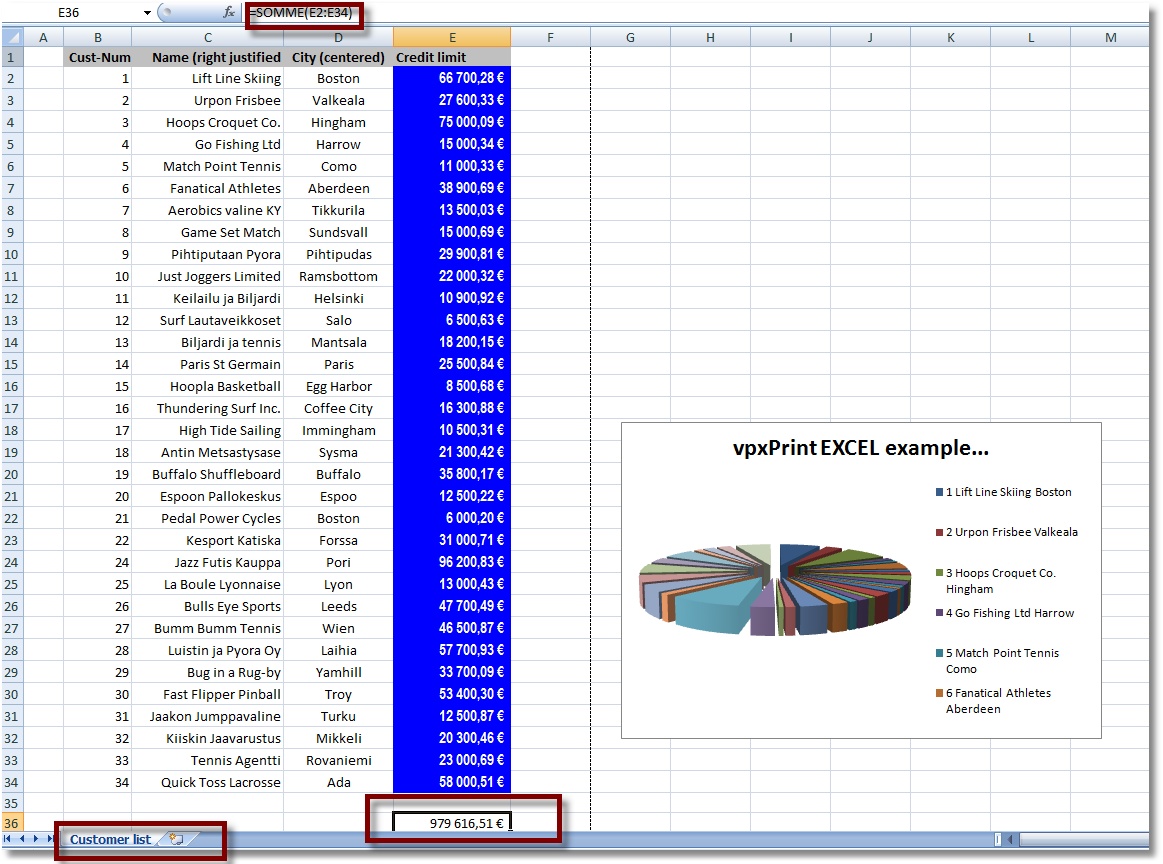
<XLS:CHART,SHEET=Customer list,Title=vpxPrint EXCEL example...> |
draw a chart, set a sheet name and a title to the excel document |
<XLS:SELECT=E2:E%9,FONT=Arial Narrow,size=11,bold, BGcolor=blue,FGcolor=white,style=Currency, SELECT=c:c,RIGHT,SELECT=D:D,center> |
select column E from row 2 to the last filled row (%9) set the background color to blue, the font color to white, currency style select the column C, applies 'right align', select the column D and center |
<XLS:SELECT=B%1:%Z1,bgcolor=ltgray> |
select from B first line (B%1) to last col row 1 (%Z1) |
<XLS:Y=%9, Y++,Y++, SELECT=%Z%Y, FORMULA==SUM(%Z2:%Z%9), LANDSCAPE,grid,fit,headerL=John Doe> |
assign Y = last row (%9) add 2 to Y select last col last row + 2 (%Z%Y) put a formula in this cell: sum(last col 2nd row %Z) to the last cell (%Z%9) set values for printing, Landscape... |
<XLS-LEFT-HEADER=header LEFT> |
values for printing |
<XLS-CENTER-HEADER=&"Arial Black,Italique"&14header LEFT> |
values for printing |
<XLS-right-footer=Page &P of &N> |
values for printing |
Excel preview:
When a display frame is closed by a </USE>, vpxPrint creates automatically a new Excel sheet.
The new sheet has the name of the current sheet with a suffix -2 -3 added to the base name.
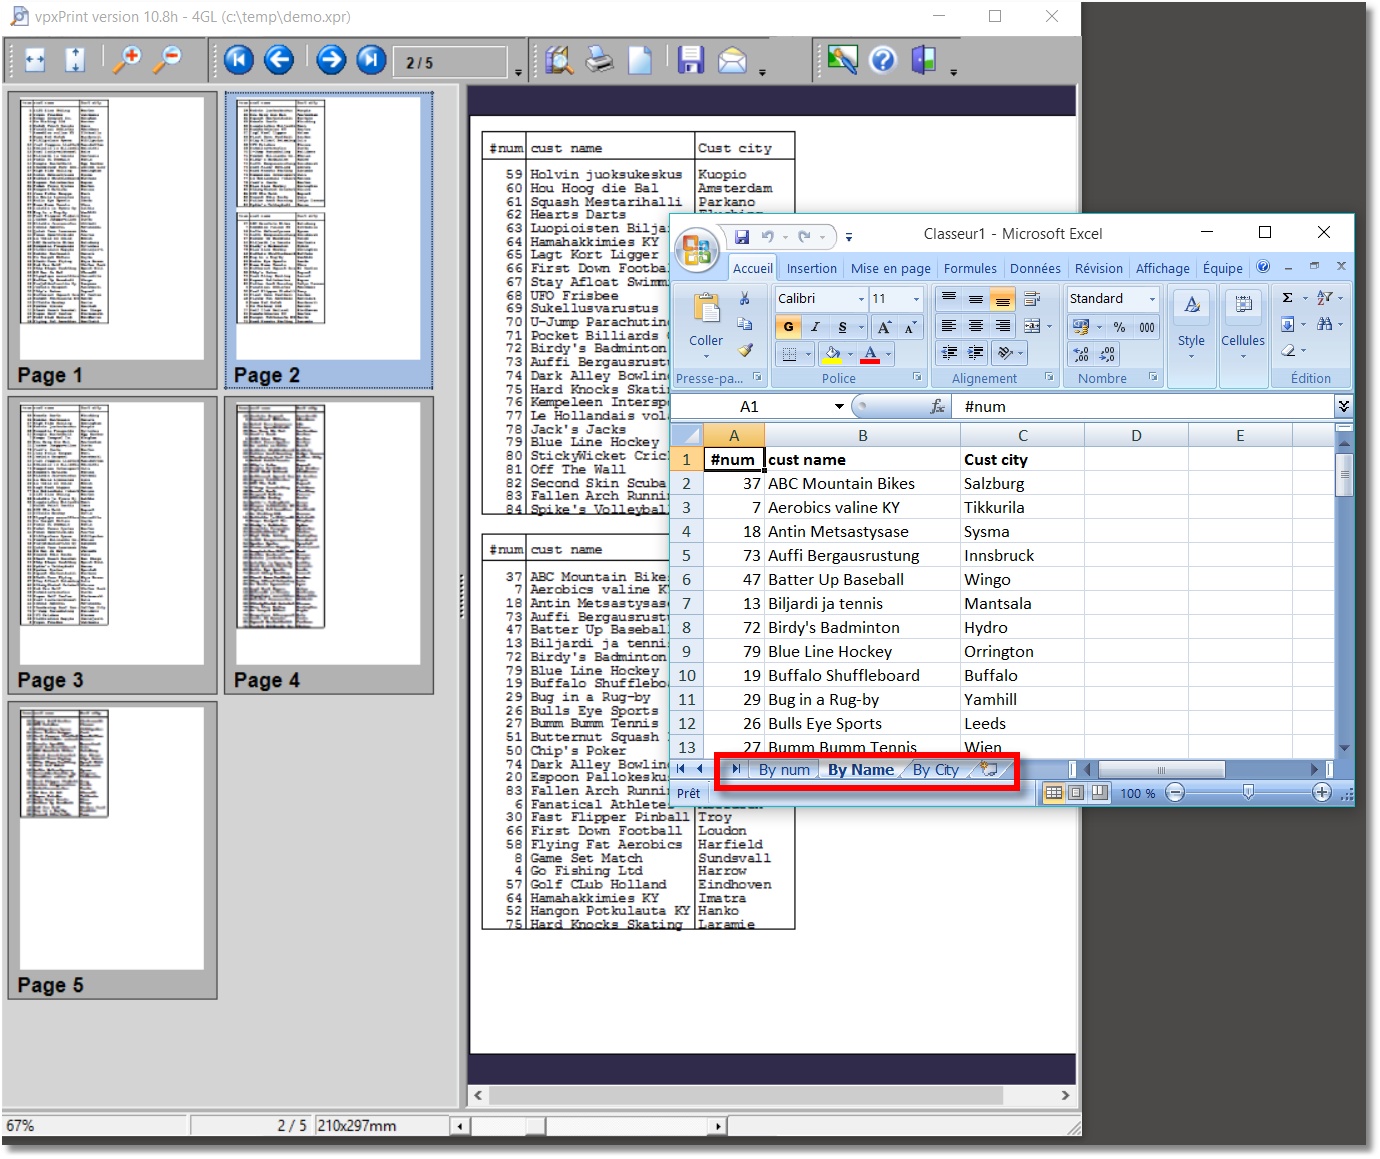
The tag <XLS:SHEET=xxxxxxxxxxxxx> allows to change this default name.
![]() Note that this value specifies the name of the current opened frame.
Note that this value specifies the name of the current opened frame.
The sheet name must be specified after the frame is started and before closing the frame.
Exception: if the Excel file contains only one sheet, the XLS:SHEET applies to the unique sheet.
Example:
{ xprint.i }
OUTPUT TO c:\temp\demo.xpr PAGED PAGE-SIZE 60.
PUT CONTROL '<preview>'.
FOR EACH customer NO-LOCK BY cust-num:
DISP cust-num LABEL '#num' NAME label 'cust name' city LABEL 'Cust city' WITH STREAM-IO WIDTH 512.
END.
PUT "<XLS:SHEET=By num></USE>".
FOR EACH customer NO-LOCK BY NAME:
DISP cust-num LABEL '#num' NAME label 'cust name' city LABEL 'Cust city' WITH STREAM-IO WIDTH 512.
END.
PUT "<XLS:SHEET=By Name></USE>".
FOR EACH customer NO-LOCK BY city BY NAME:
DISP cust-num LABEL '#num' NAME label 'cust name' city LABEL 'Cust city' WITH STREAM-IO WIDTH 512.
END.
PUT "<XLS:SHEET=By City></USE>".
OUTPUT CLOSE.
RUN printfile('c:/temp/demo.xpr').